Carbon dioxide
Oil
Coal
Deforestation

How nature is key to achieving a 1.5˚C world

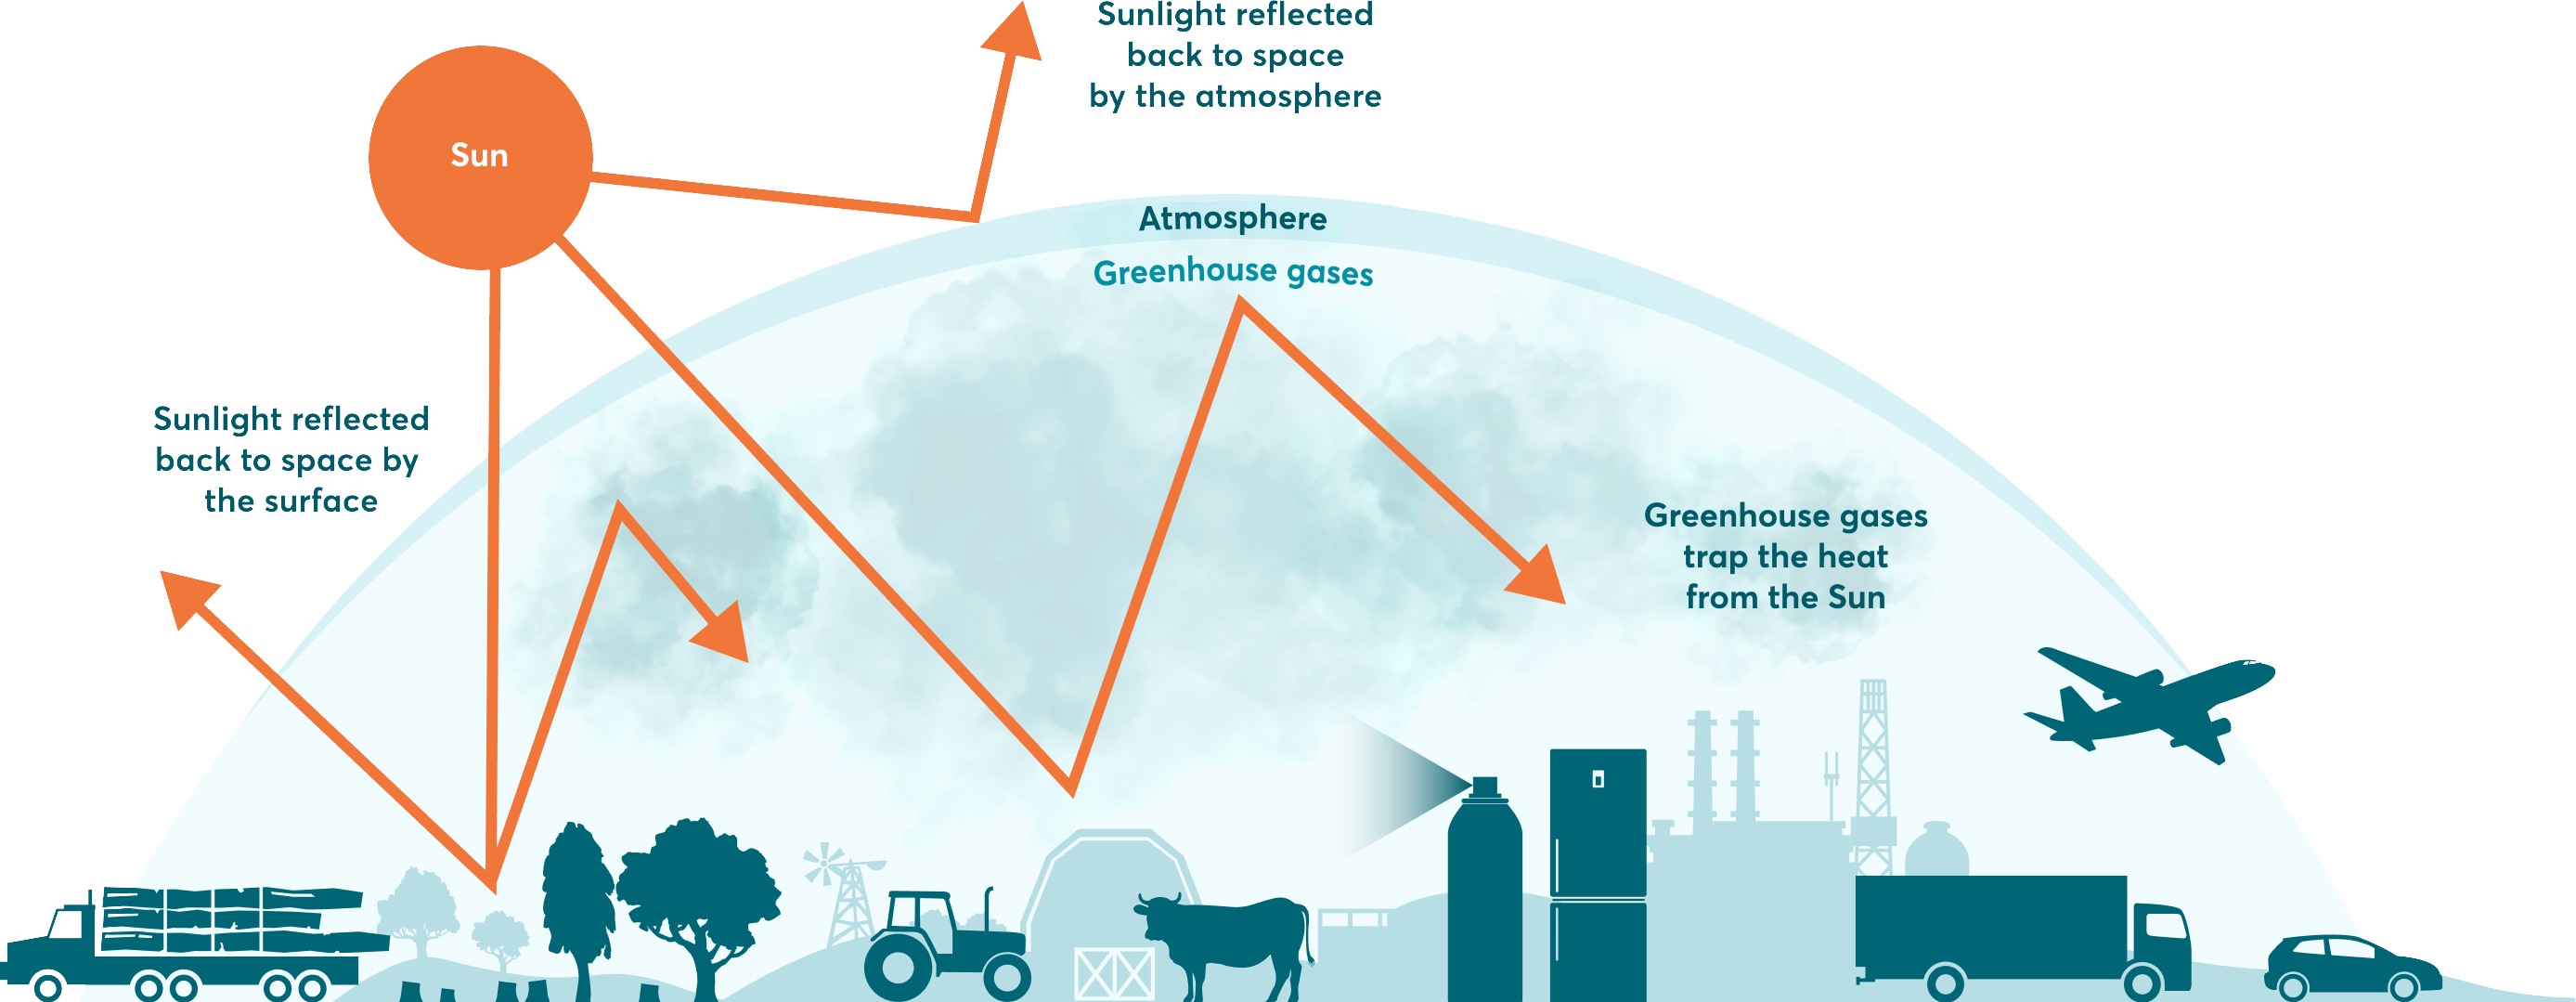
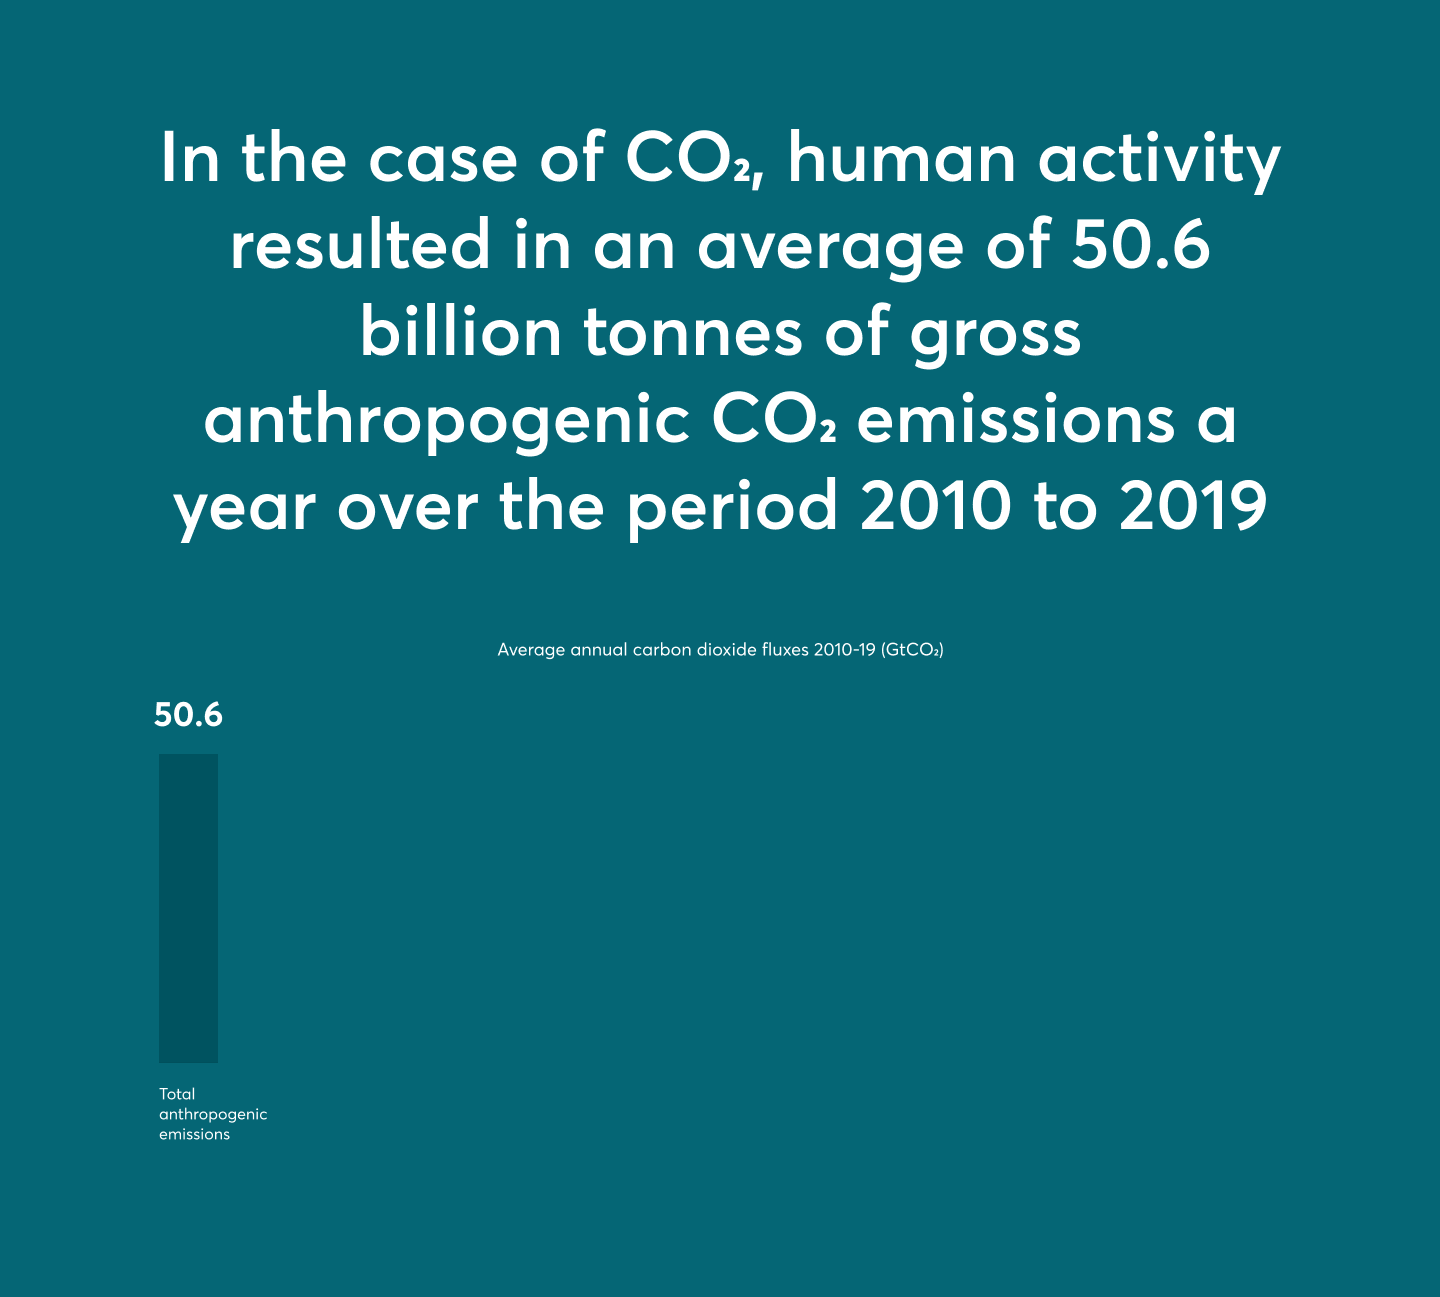
Human activity has increased the release of greenhouse gases (GHGs) into the atmosphere
GHGs are the gaseous constituents that trap heat in the atmosphere. They are released through natural processes (e.g. decomposition of biomass) and as a result of human activity (e.g. the burning of fossil fuels). Some gases are naturally occurring (e.g. carbon dioxide) while others are human-made (e.g. the halocarbons). Carbon dioxide (CO2) is the largest single contributor to climate change. The United Nations Framework Convention on Climate Change covers the following GHGs:
The GWP allows comparisons of the global warming impacts of different gases over specific timeframes. CO2 is the reference gas and so the GWP is 1.

Increasing concentrations of GHGs in the atmosphere have caused a warming of the Earth's mean surface temperature. This is referred to as the greenhouse effect.
Human activities release
greenhouse gases
Methane
Cattle
Fertilizer
CFCs & Haloalkane
Refrigerators
Aerosols
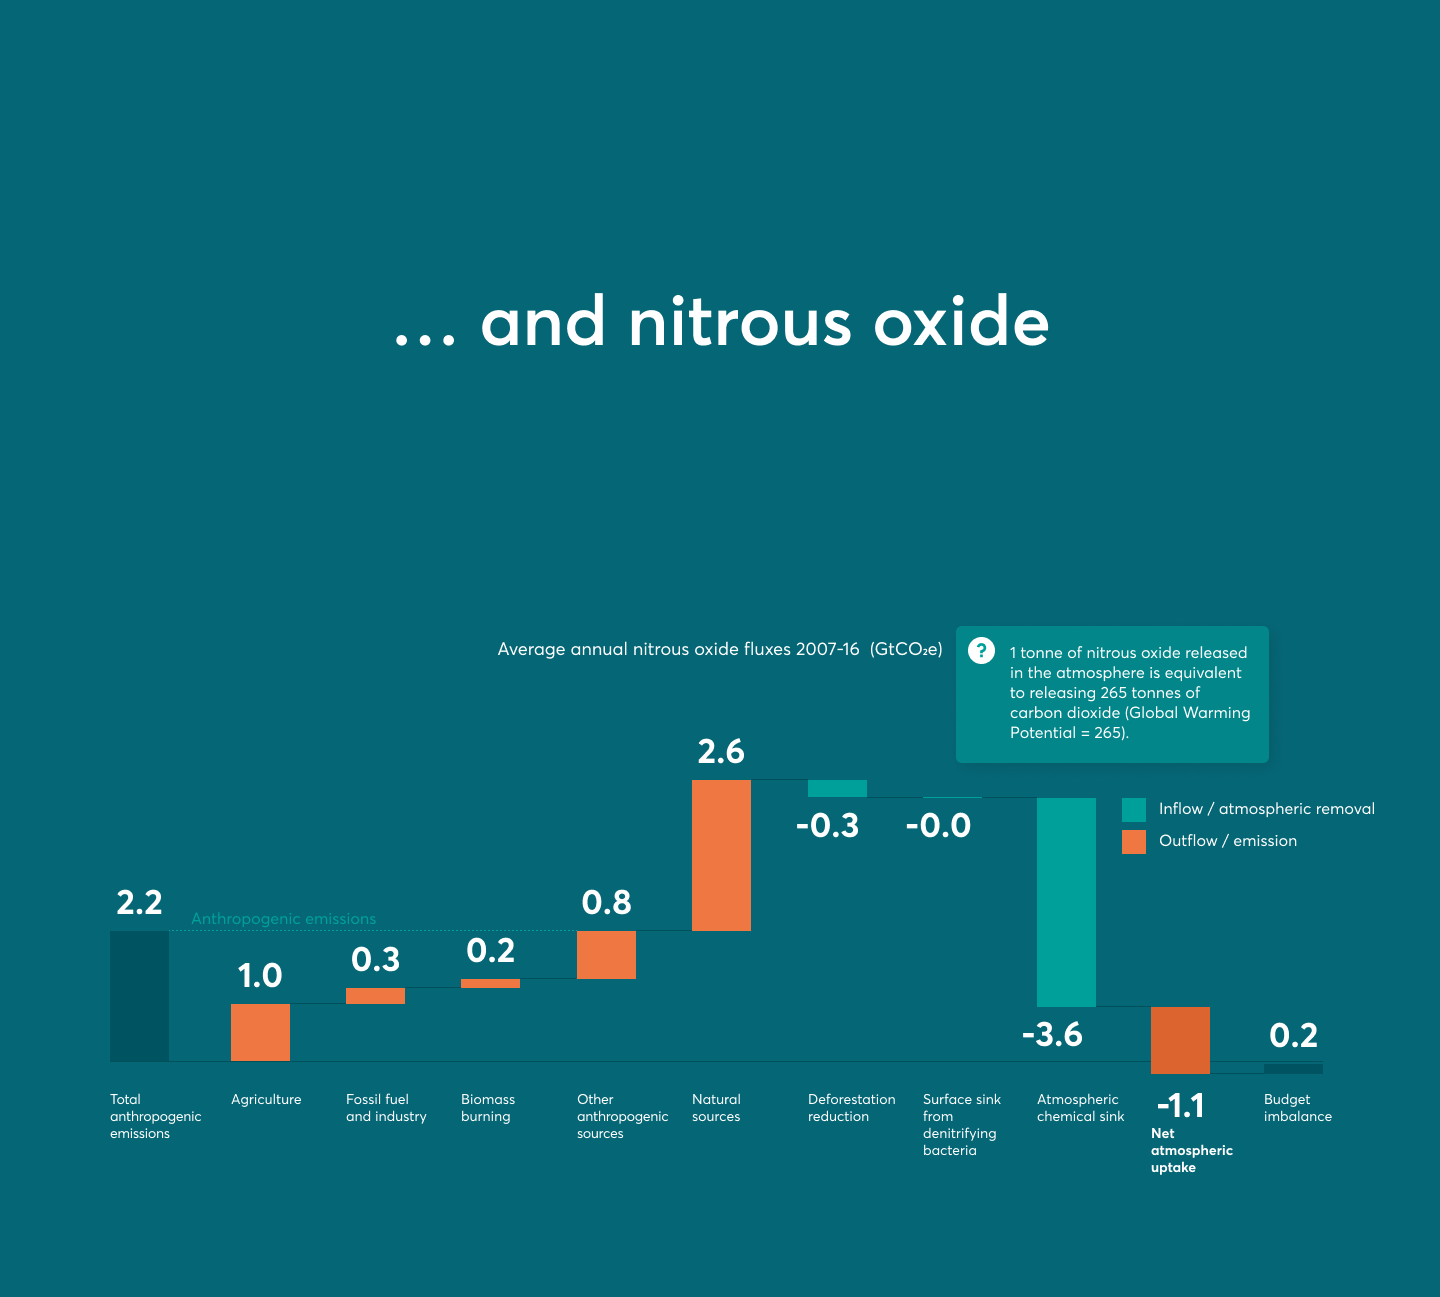
Nitrous oxide
Gasoline
Agriculture
The three main systems capable of storing carbon and nitrogen, known as “stocks” or “pools”, include the land ecosystems, the ocean and the Earth’s crust.
Carbon and nitrogen not stored in these pools resides in the atmosphere as a component of greenhouse gases.

Land ecosystems (such as forests and peatlands): Plants absorb carbon through photosynthesis. The carbon they capture is stored in vegetation or integrated into soils when plants die. The breakdown of plant material and soil by microorganisms leads to emissions.

The Earth’s deep mantle sequesters carbon through sedimentation and other geological formations, on geological timescales (many millennia). Carbon is released into the atmosphere through the extraction and combustion of fossil fuels.

Atmospheric CO2 dissolves into the ocean, and phytoplankton also sequester carbon by photosynthesis, while deep cold waters absorb carbon.

What is released or cannot be stored by other carbon stocks accumulates into the atmosphere.
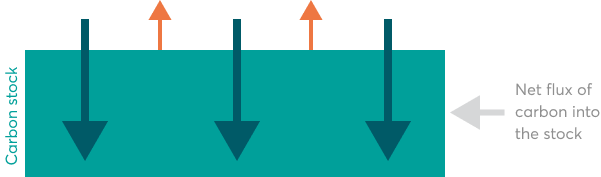
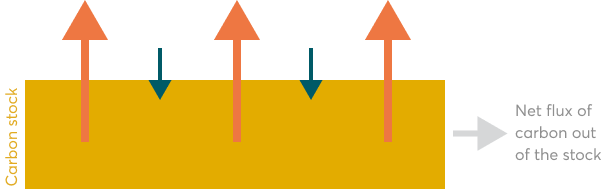
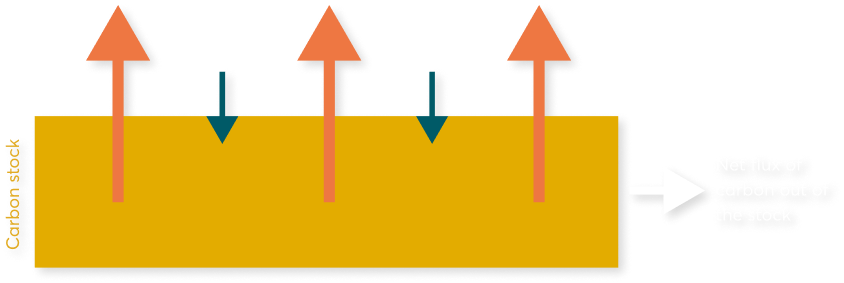
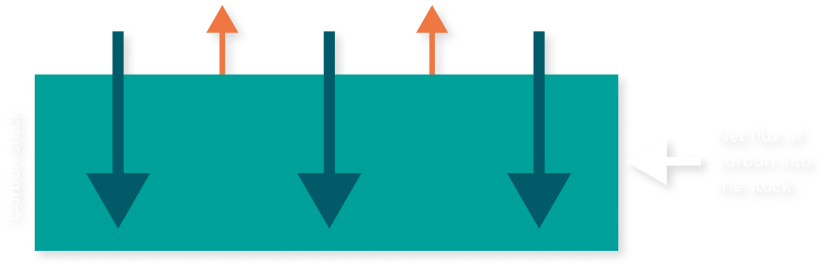
Whether a stock is considered a "sink" or a "source" of greenhouse gases depends on the net flux of 1) emissions out of the stock and into the atmosphere and 2) removals from the atmosphere and into the stock.
atmospheric removal
emission
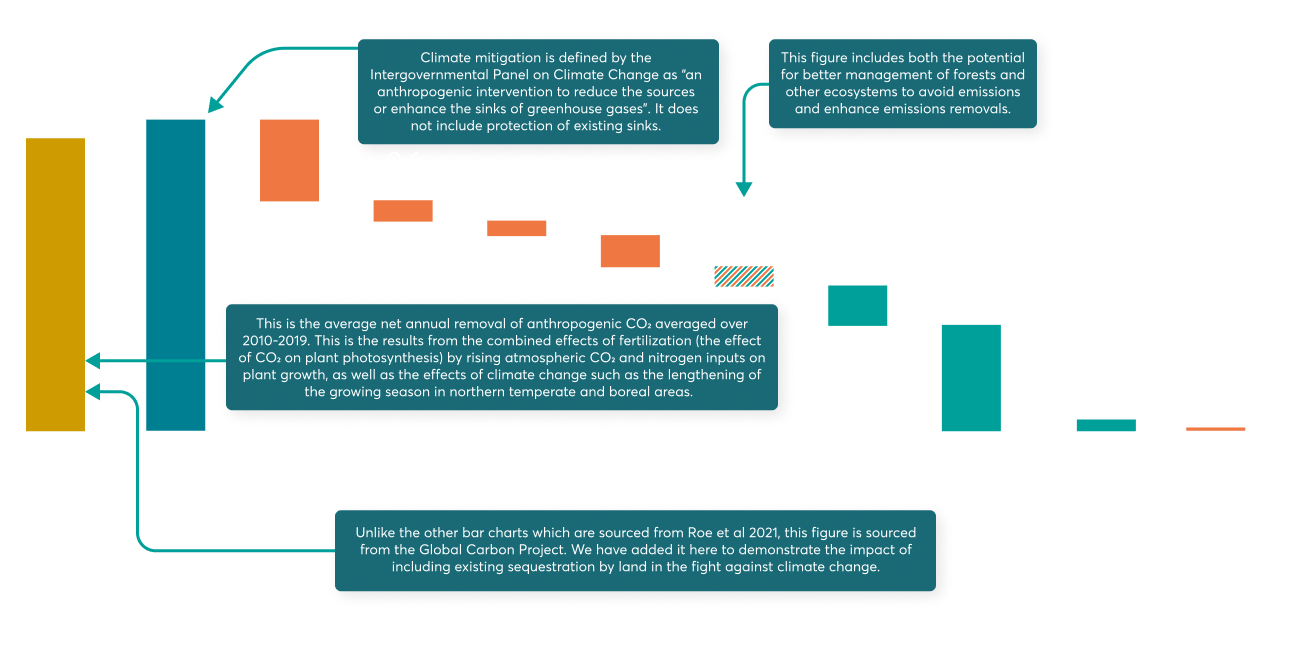
For example, forests are the largest terrestrial sink - globally, their net removal of carbon is equivalent to 5.7 billion metric tonnes of carbon dioxide (GtCO2) a year. This represents 45% of carbon dioxide sequestration from the land sink.


This is already happening in forest areas across the tropical belt…
This map shows the net carbon sinks (green) and sources (red) from forests across the period 2001-19 (MtCO2e). The largest sinks are found in tropical forests. The largest sources are found in disturbed tropical forests.
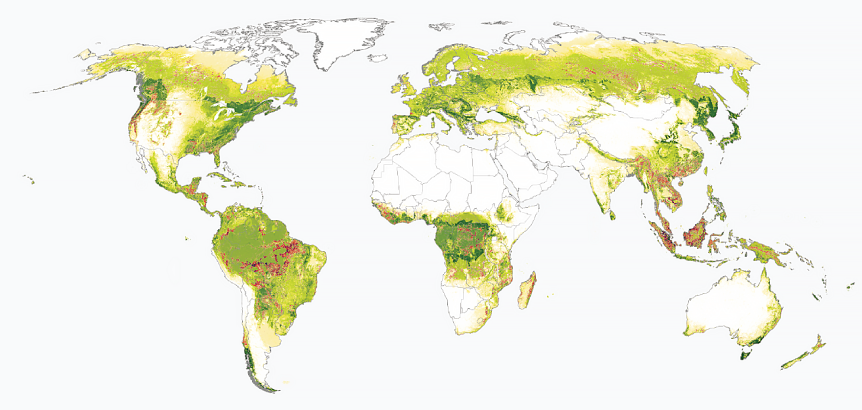

Net annual forest-related greenhouse gases fluxes
2. Stock-take: the flow of greenhouse gas emissions into and out of the atmosphere today
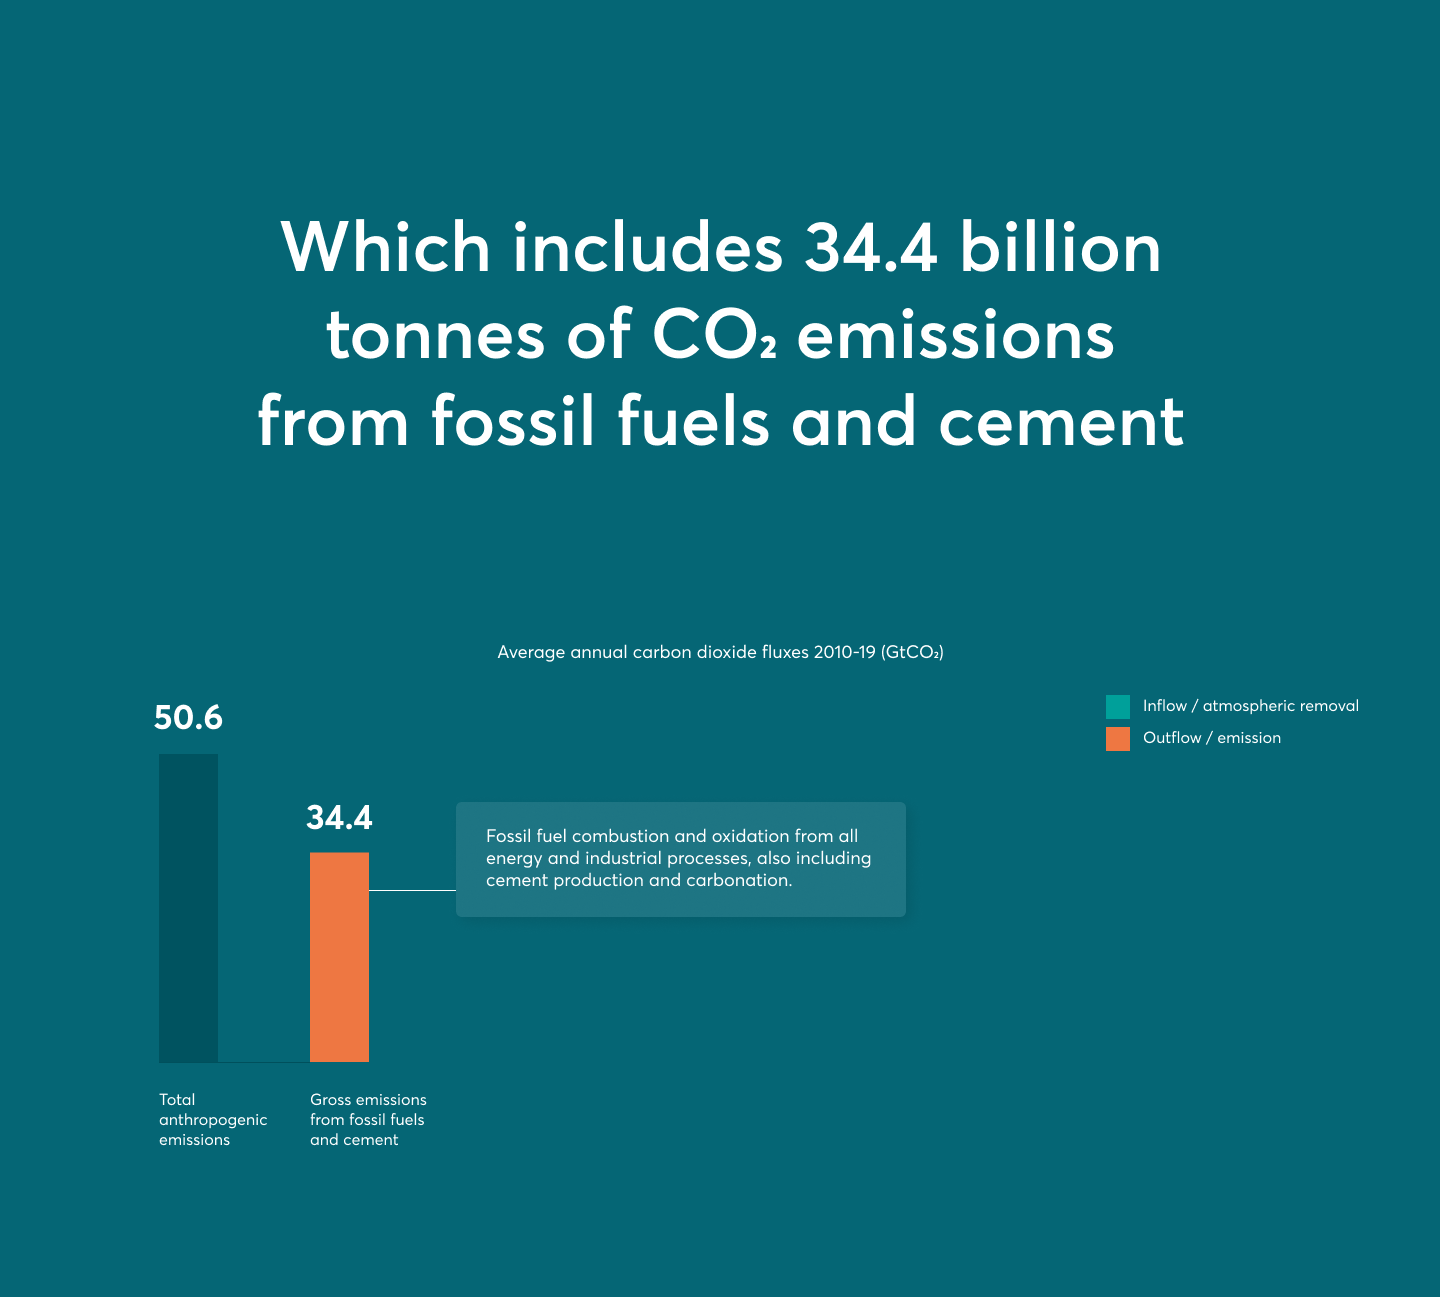
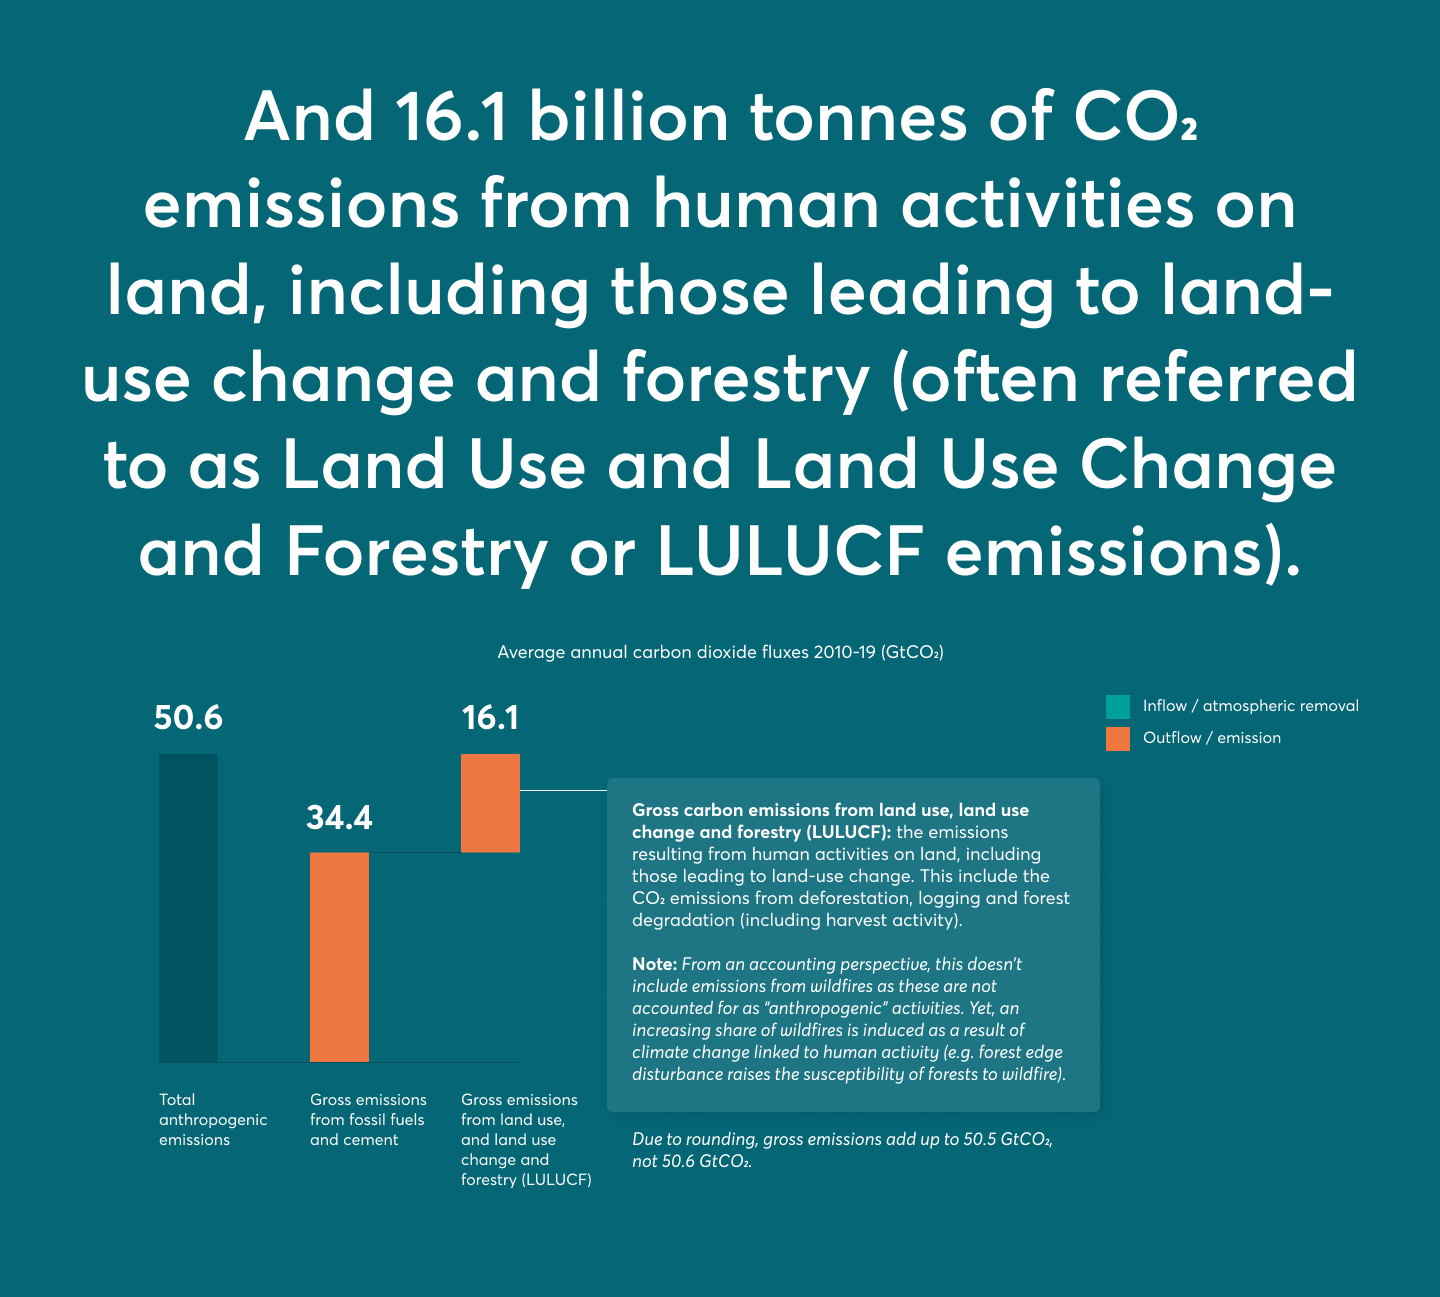
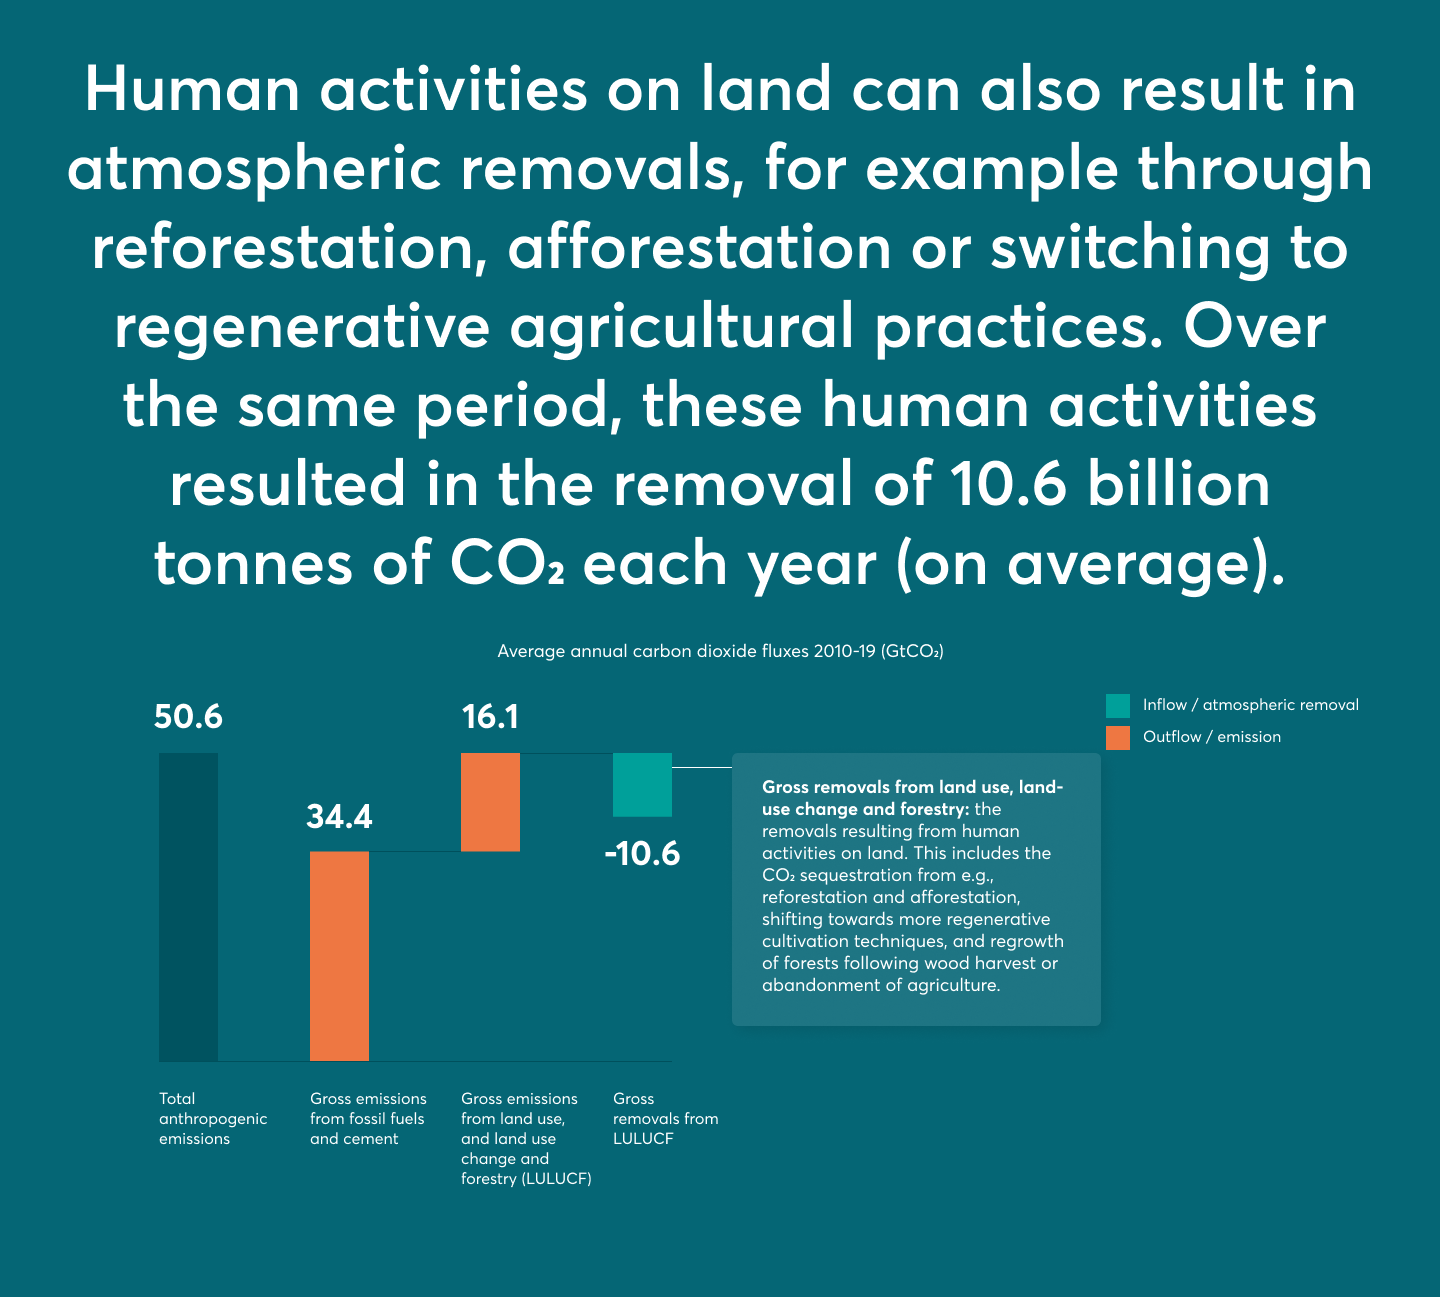
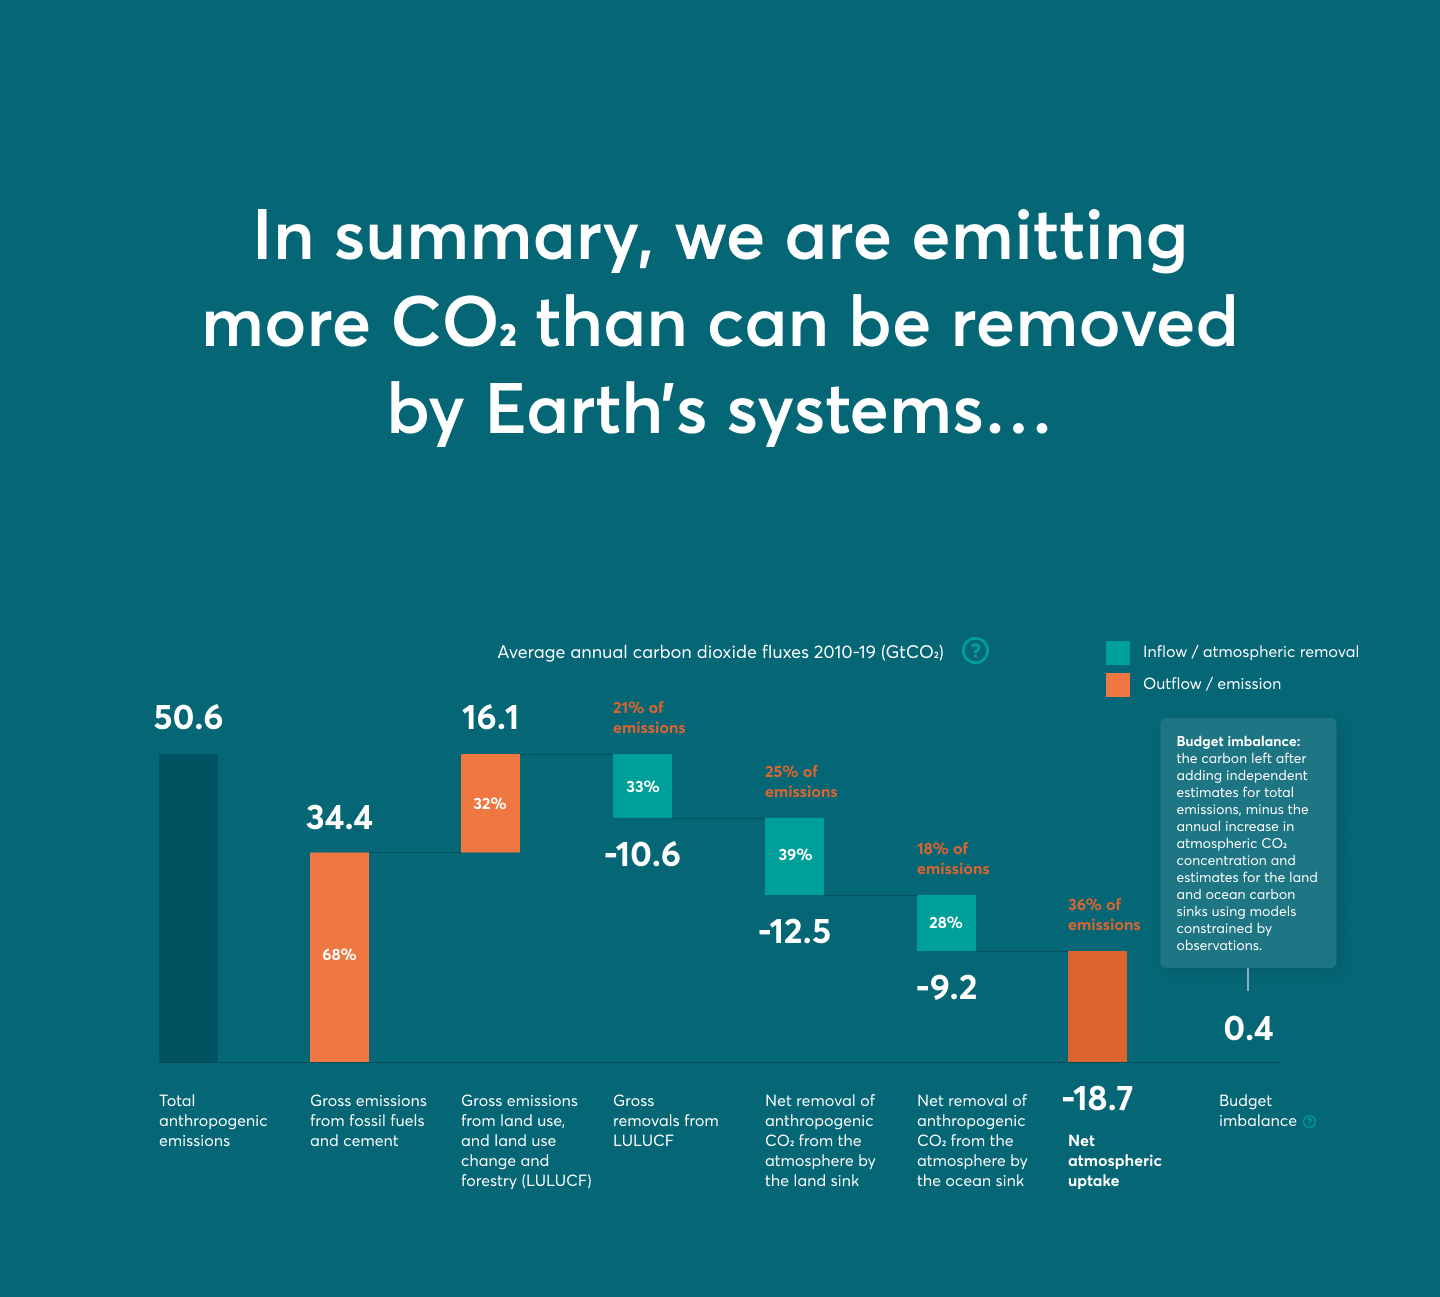


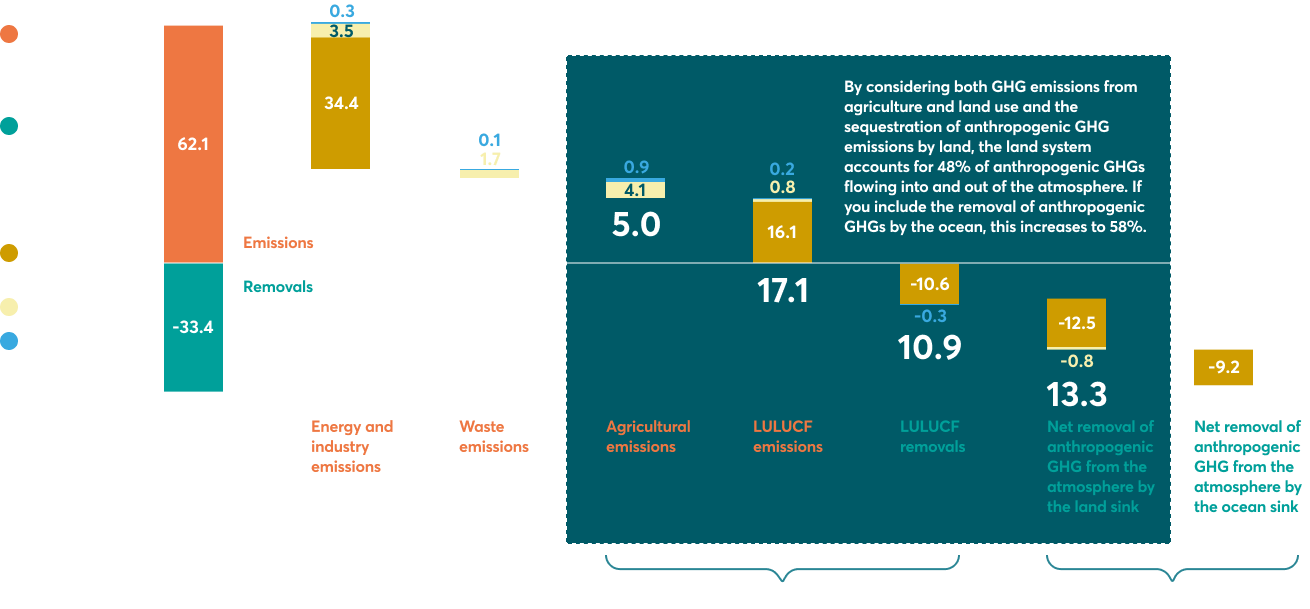
Emissions from human activities on land, including those leading to land-use change and forestry (LULUCF emissions) are often cited as accounting for 10-15% of global CO2 emissions (~38.5 GtCO2).
But by focusing on net CO2 fluxes, this approach underplays the significance of the land sector in climate mitigation.
Considering non-CO2 gases and looking at the gross fluxes instead of net emissions, the contribution of the land system to climate change is startling, representing 48% of all anthropogenic GHGs flowing in and out of the atmosphere.
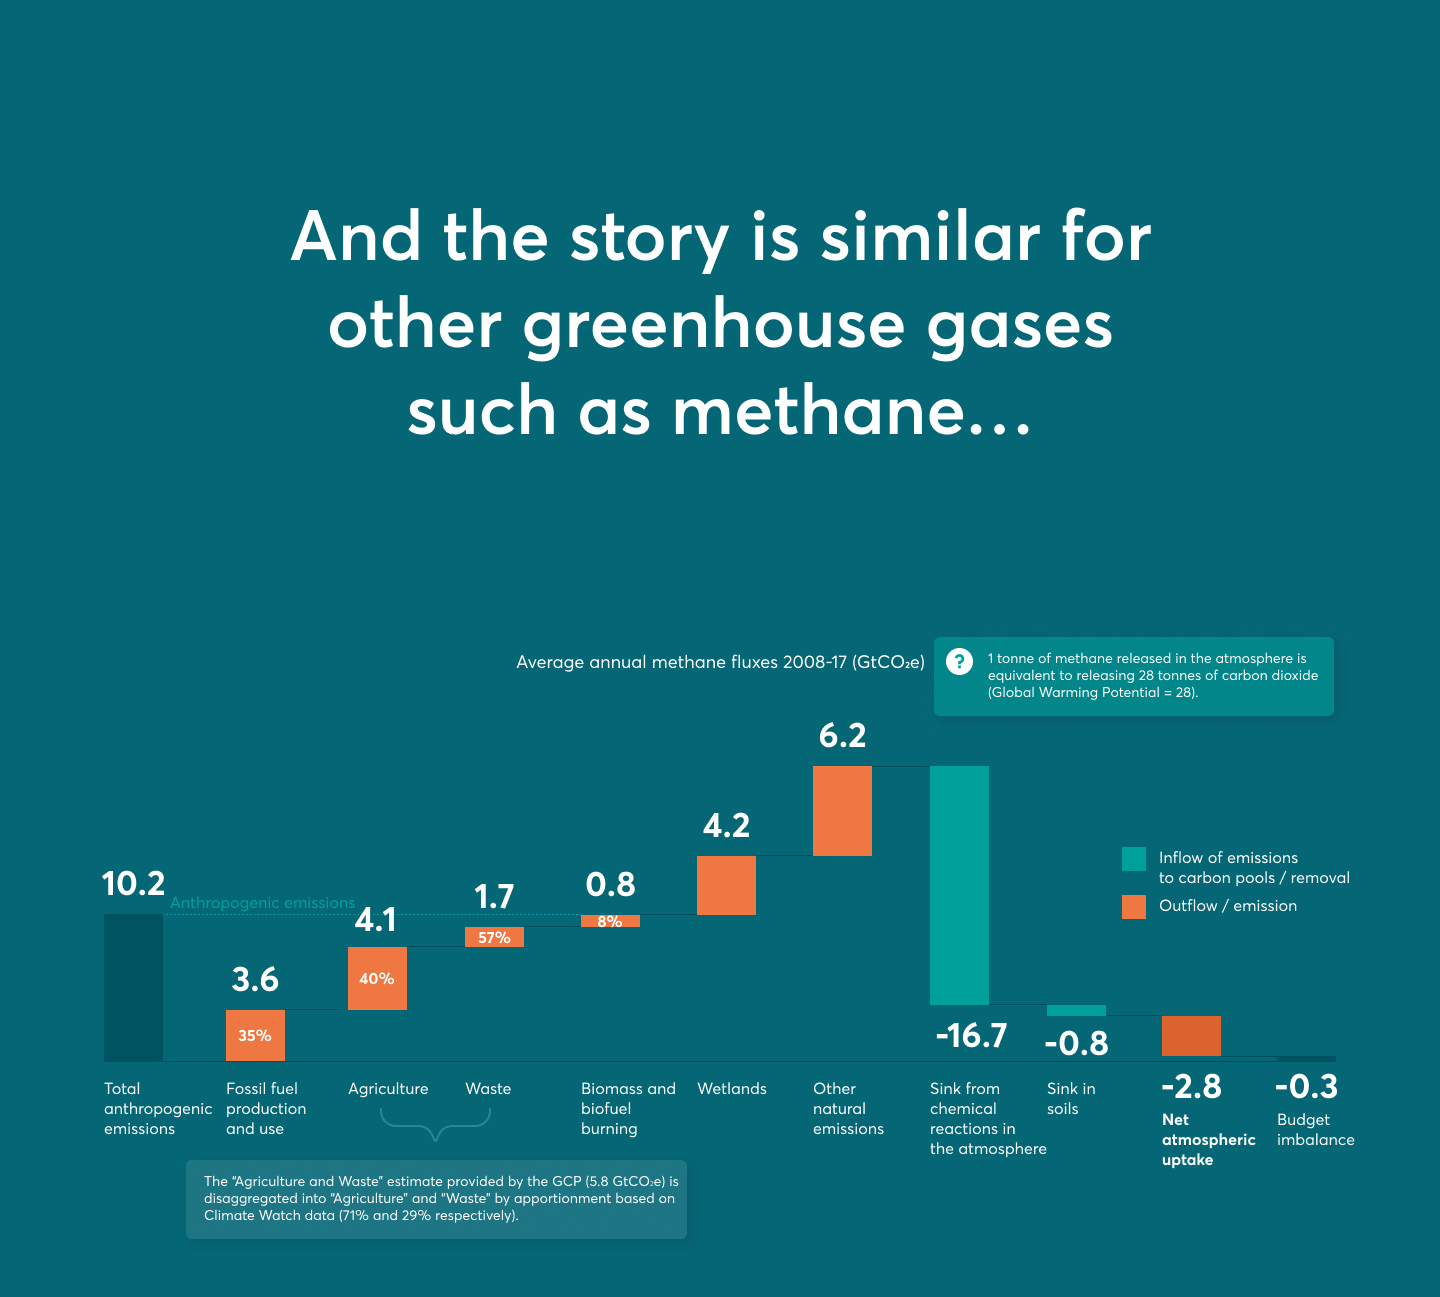
Annual emissions and removals for carbon (average 2010-19), methane (av. 2008-17)
and nitrous oxide (2007-16), GtCO2e.
3. Rising risk of catastrophic impacts: temperature thresholds, carbon budgets, and tipping points
We have already reached 1.09˚C of warming compared to pre-industrial times (circa 1850) as a result of increasing greenhouse gas emissions into the atmosphere.
 @ed_hawkins
Sixth Assessment Report
Scientists have established 1.5˚C as the safer upper limit for warming (compared to pre-industrial times) to avoid the catastrophic impacts of climate change.
Climate change will significantly impact our society’s production systems, vital economic and social infrastructures, government facilities, threatening our jobs and livelihoods.
The frequency of disasters, the survival of plants and animals, the spread of diseases, the stability of our global climate system and – ultimately – the possibility for humanity to survive on this planet hinge on these few degrees.
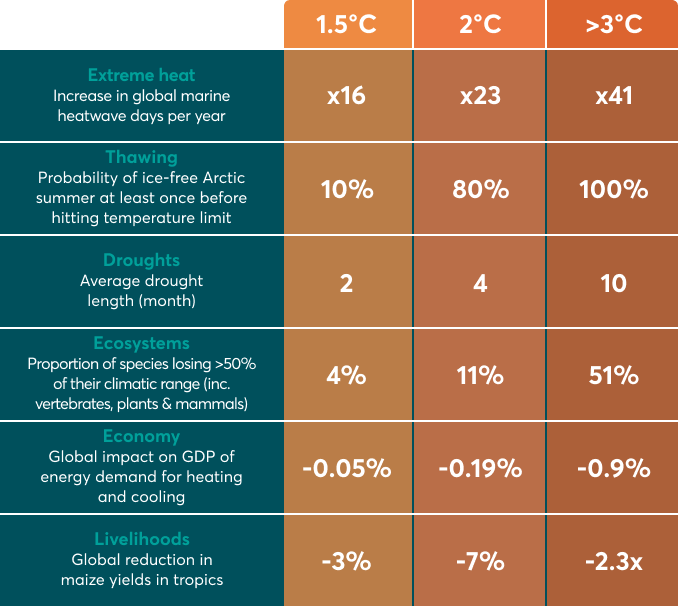
The Paris Agreement signatories committed to keep global warming well below 2˚C above pre-industrial levels and pursue efforts to limit it to 1.5˚C. Even with 1.5˚C of warming the world will face severe climate impacts, but these get significantly worse with 2˚C.

But there is uncertainty associated with the remaining budget due to the existence of “tipping points” where the land and ocean processes that capture GHGs could begin to weaken.
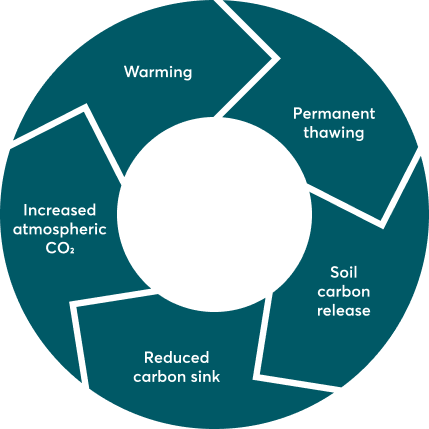
Scientists are increasingly concerned about the existence of tipping points (defined as “critical thresholds beyond which a system reorganizes, often abruptly and/or irreversibly”) linked to a number of “Earth system feedbacks”.
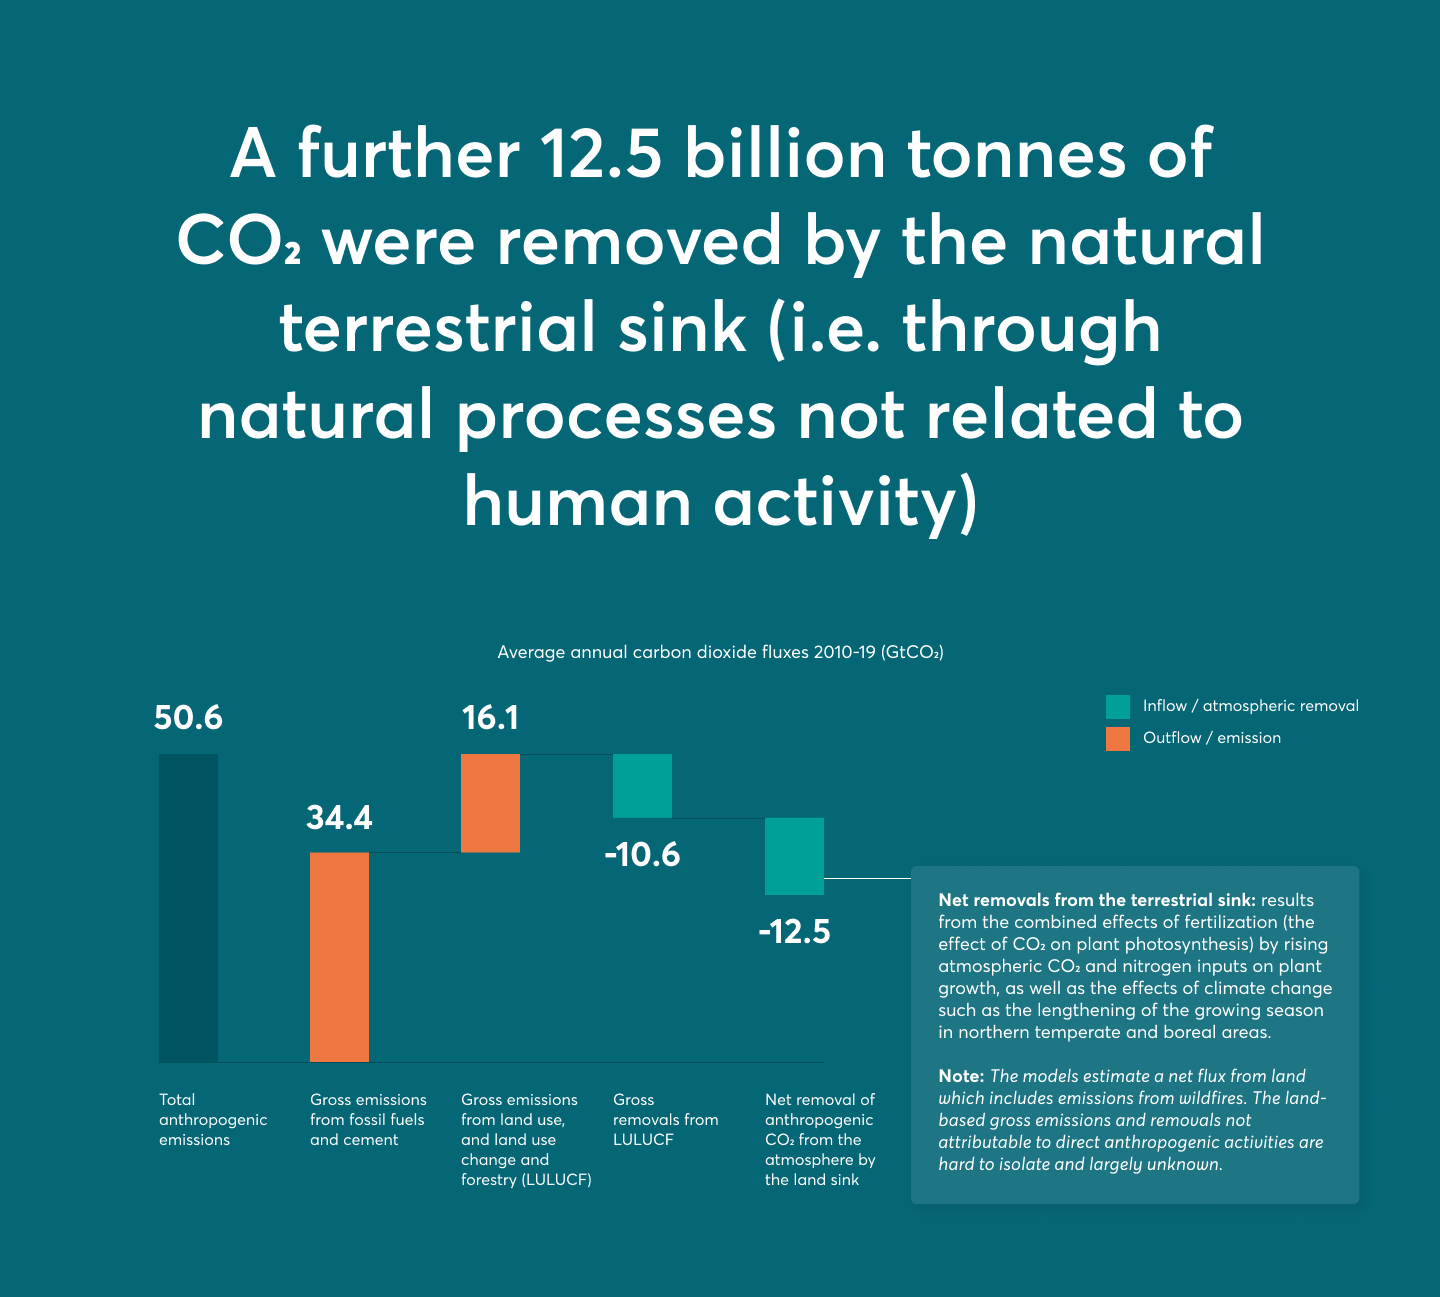
For example, increased GHG concentration in the atmosphere leads to warming, which in turn results in reduced rates of carbon sequestration by the land and ocean sink (for example, either by causing wildfires or by reducing the rate of photosynthesis in plants) which further accelerates the change in atmospheric GHG concentration and climate.
Latest research suggests that rising temperatures could lead to a near halving of the land sink strength due to reduced photosynthesis by as early as 2040.
While the latest carbon budget – as set out in the Sixth Assessment Report of the Intergovernmental Panel on Climate Change - takes into account a number of these Earth system feedbacks such as permafrost thawing, there is a high degree of uncertainty, meaning the remaining carbon budget could be overestimated. Recent research suggests that the budget for remaining below 1.5˚C has a 17% chance of already being negative (i.e. we have already surpassed it).
To reduce the risk of triggering these ecological and climate tipping points, we must reduce emissions as rapidly as possible and protect and enhance the remaining natural carbon sinks.
Example of an Earth system feedback: permafrost thawing.
Thawing releases CO2 and CH4 into the atmosphere, which increases warming and causes further thawing of the permafrost.
This is complicated stuff... To help you find your "Eureka" moment, let's simplify it with the analogy of the bath tub...
To help you find your "Eureka" moment, let's simplify it with the analogy of the bath tub...

The water level represents the stock/ pool of carbon dioxide and other greenhouse gases in the atmosphere.

The inflow of water represents flows of emissions into the atmosphere, e.g. from burning fossil fuels. The more water flowing in, the more the tub fills.

The water draining out represents the sequestration or removal of emissions out of the atmosphere and into the sinks such as forests and the ocean.

The remaining carbon budget is the limit before the bathtub overflows.

The bathtub is dangerously close to overflowing.
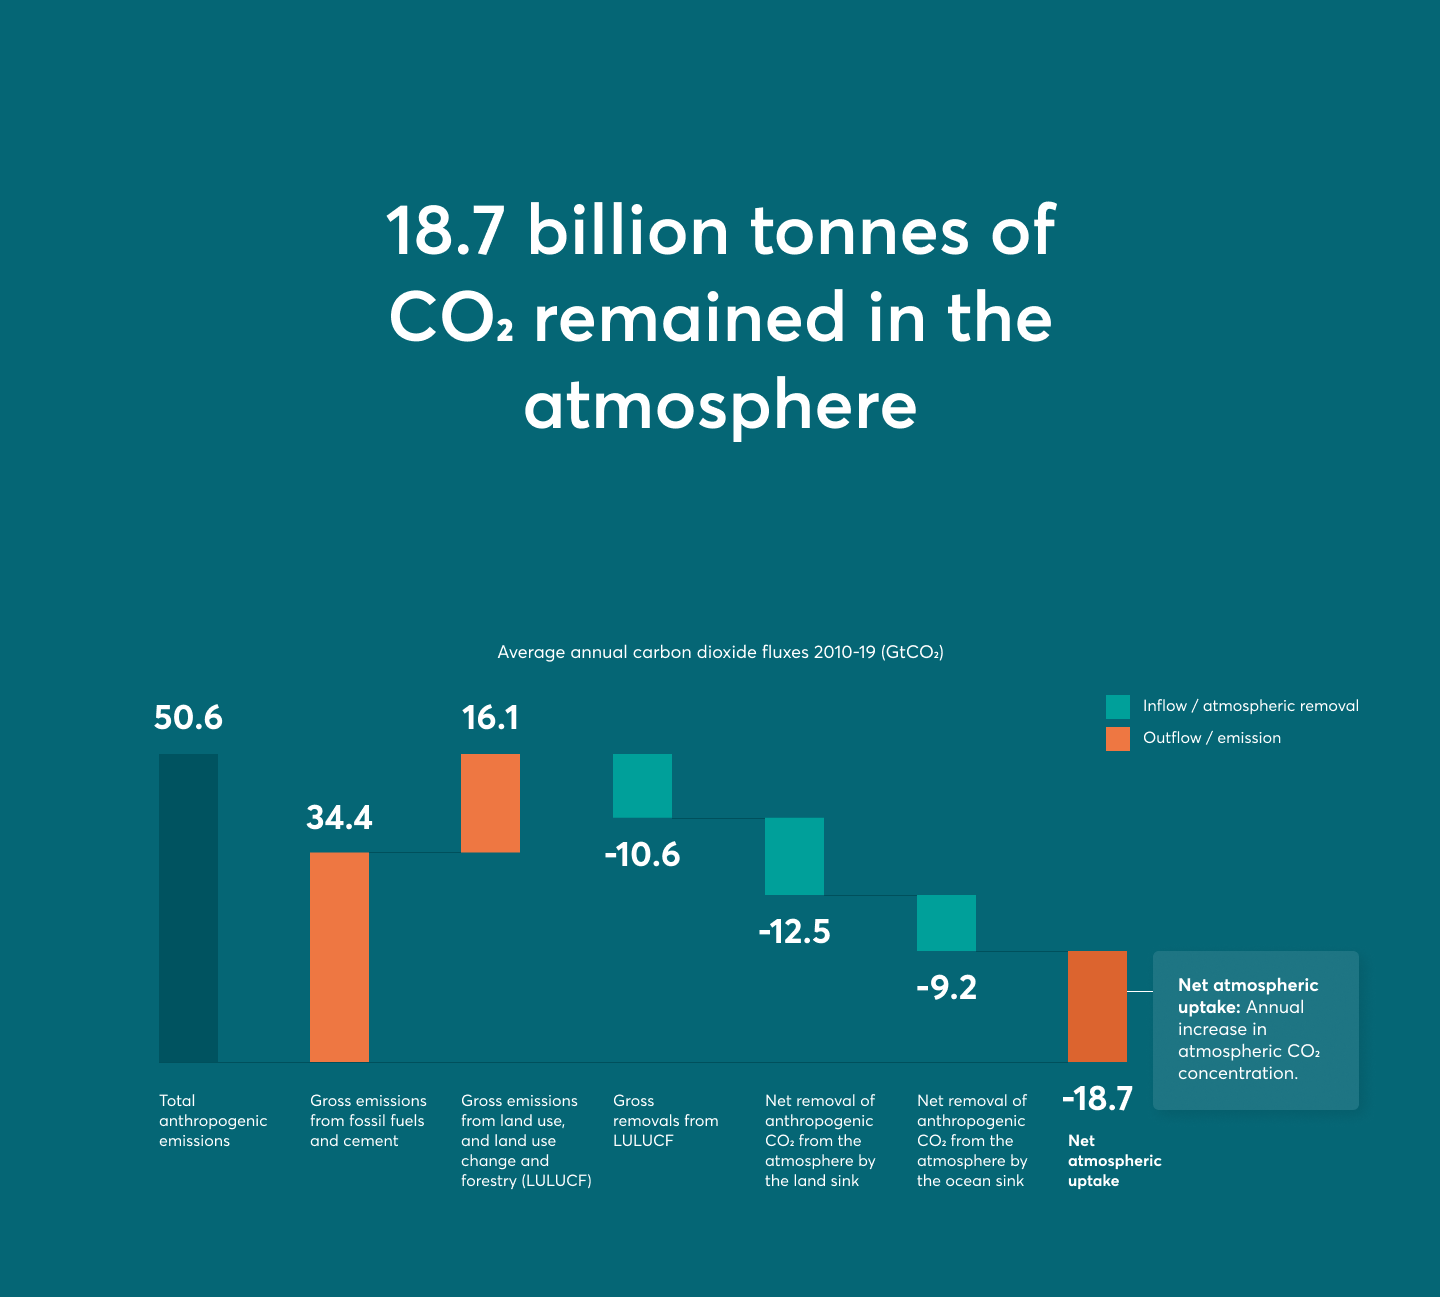
Annual CO2 fluxes (GtCO2) in 2010-19
Figures are average emissions / removals for the period 2010-19, from the Global Carbon Project (2020).

And ecological tipping points could accelerate it even further.


So, what do we do?
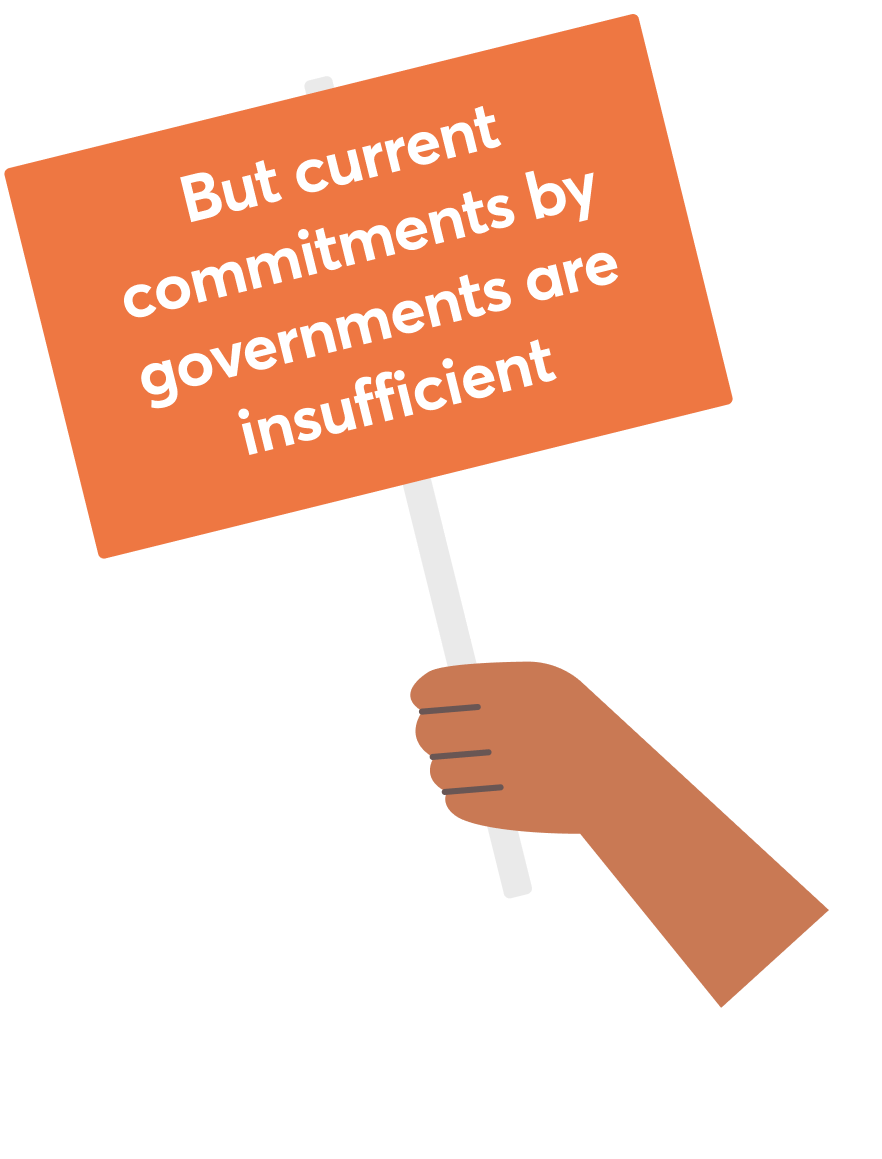
A bottom-up assessment of the Nationally Determined Commitments provided by countries as of May 2021 shows that a substantial ambition gap remains based on the levels of net emissions expected in 2030.
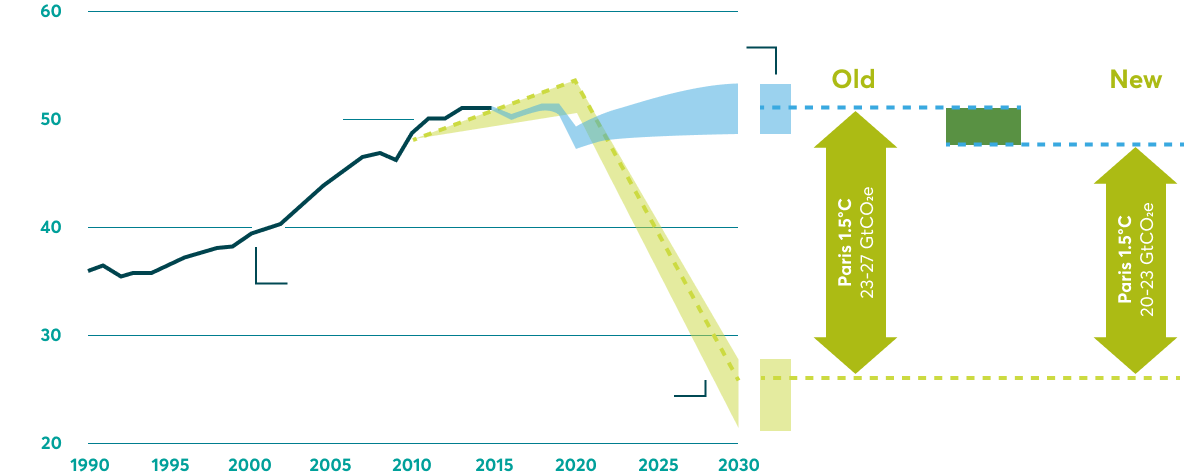
We therefore need to significantly raise ambition and speed
on reducing emissions (lever 1) in both the energy sector…
Achieving net zero emissions by 2050 (and thus keeping within 1.5˚C) requires all
governments and companies to raise their ambitions.
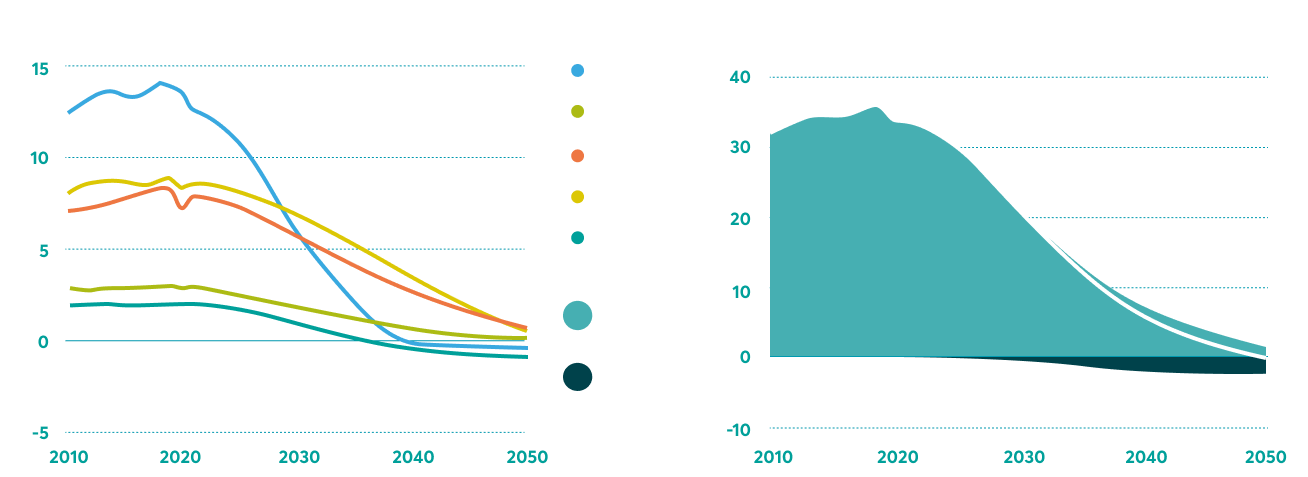
Systems wide transformation includes:
By 2025:
- No new sales of fossil fuel boilers
- No new unabated coal plants, coal mines (or extensions) or oil and gas fields approved for development
By 2030:
- Universal energy access
- All new buildings zero-carbon ready
- 60% of global car sales are electric
- Phase-put of unabated coal in advanced economies
2035:
- 50% of heavy truck sales are electric
- No new internal combustion engine car sales
- Overall net zero emissions electricity in advanced economies
2040:
- 50% existing buildings retrofitted to zero-carbon-ready levels
- 50% fuels in aviation are low emission
- Net zero emissions electricity globally
2045:
- 50% of heating demand met by heat pumps
2050:
- More than 85% of buildings zero-carbon ready
- Almost 70% of electricity generation globally from solar PV and wind
... and the land sector
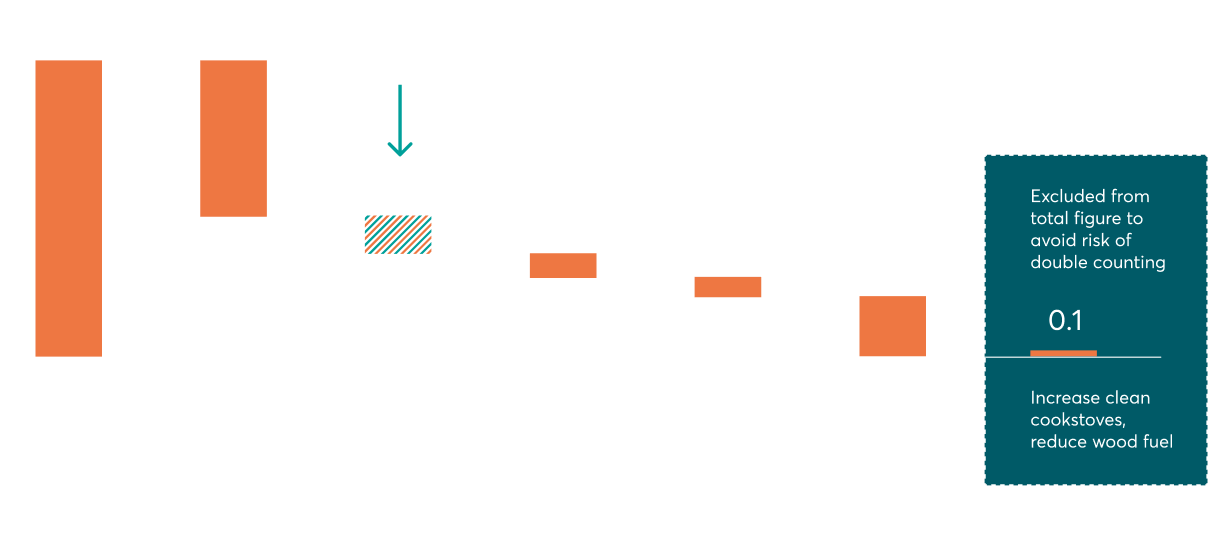
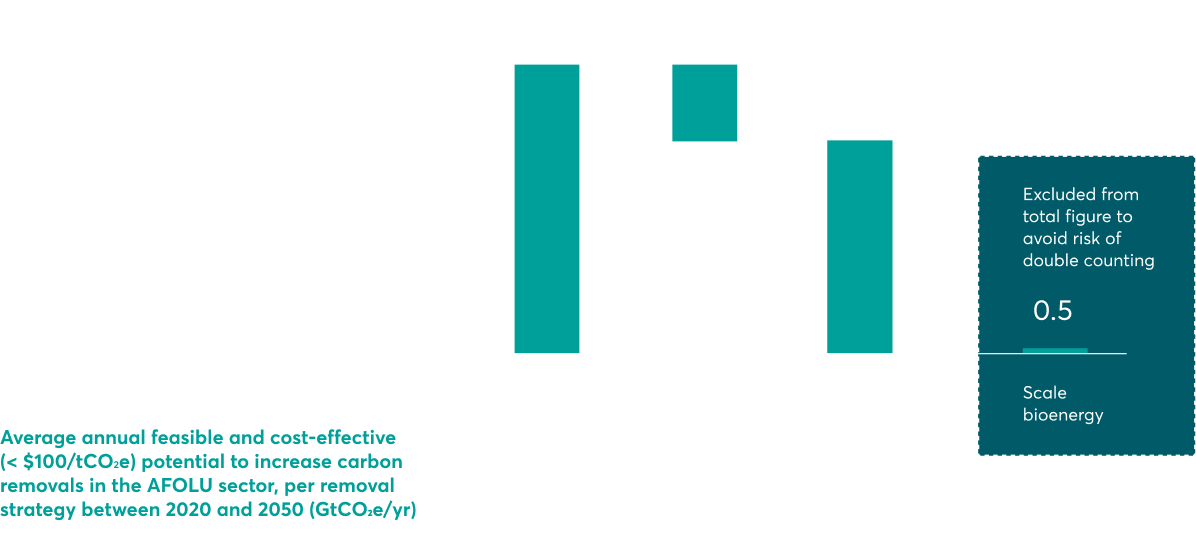
Emissions reduction potential in the Agriculture, Forestry and Other Land Use sector can reach 7 GtCO2e per annum to meet the 1.5°C warming target by 2050.
Average annual feasible and cost-effective (< $100/tCO2e) emissions reduction potential in the AFOLU sector, per reduction strategy between 2020 and 2050 (GtCO2e/yr)
…and simultaneously pull much harder on our
second lever to protect and enhance GHG sinks.
We can also enhance sinks through engineered
"negative emission technologies”.

GHGs can be removed from the atmosphere with biological or engineered chemical processes and stored for long periods of time in the ground, ocean or built environment.
These human engineered negative emissions technologies will undoubtedly complement nature-based removals but their costs are much higher, their potential for mitigation is highly uncertain, they lack co-benefits associated with wider SDGs and they have the potential to drive further inequality and wealth concentration.
Single actions (such as protecting standing forests) can pull on both levers at the same time.
For example: protect tropical forests
and improve their management
Prevents the forest carbon sink from becoming a
source of emissions through combustion of biomass.
Maintains the capacity of the protected forest to
sequester carbon dioxide both today and in the future.
It is also important to note that plantations are much poorer at storing carbon than natural forests, which develop with little or no disturbance from humans. Hence the importance of protecting existing, natural forests.
If nothing is done to protect existing natural carbon sinks, gigantic quantities of carbon could be released in the atmosphere and make it virtually impossible to maintain temperatures below 1.5°C warming.
In fact, at least 260 billion tonnes of irrecoverable carbon (GtCO2) are stored in ecosystems highly impacted by human activities around the world, particularly in peatlands, mangroves, old-growth forests and marshes.
Irrecoverable carbon means that, if released, it would not be possible to recapture that carbon on a timeframe relevant to meeting the target of zero net emissions by 2050 and maintaining temperatures below 1.5°C.
This carbon is highly vulnerable to release into the atmosphere as a result of human management/ use of land.
The most tried and tested method for
capturing carbon dioxide from the
atmosphere is the one the planet has been
utilising for millions of years: photosynthesis.
As a result, “natural climate solutions” are
expected to provide the lions share of carbon
removal in the next 30 years.
5. Natural climate solutions: climate mitigation, co-benefits and cost-effectiveness
Natural climate solutions (NCS) are the activities that reduce land and marine emissions and protect and enhance land and marine removals.
NCS are defined as: conservation, restoration, and/or improved land and ocean management actions to increase carbon storage and/or avoid greenhouse gas emissions across global marine ecosystems, forests, wetlands, grasslands, and agricultural lands.
Categories of natural climate solutions
- Emissions removal
- Emissions reduction
Demand side
- Reduce food waste
- Shift to healthier diets
- Increase cleaner cookstoves
Supply side
Land and ocean use
- Reduce deforestation
- Reduce mangrove conversion (and other blue carbon ecosystems*)
- Reduce peatland degradation
- Improve forest management
- Grassland fire management
* Blue carbon ecosystems are defined as the vegetated coastal and marine ecosystems that sequester and store carbon (e.g. mangroves, salt marshes, and seagrass beds)
Carbon dioxide removal
- Afforestation / reforestation
- Restore mangrove (and other blue carbon ecosystems*)
- Restore peatland
- Soil carbon sequestration in grazing lands
- Soil carbon sequestration in croplands
- Biochar application
- Bioenergy with carbon capture and storage
- Ocean fertilization & alkalinity
Agriculture
- Enteric fermentation
- Manure management
- Nutrient management
- Rice cultivation
- Agroforestry
- Biochar from crop residues
- Soil organic carbon in croplands
- Soil organic carbon in grasslands

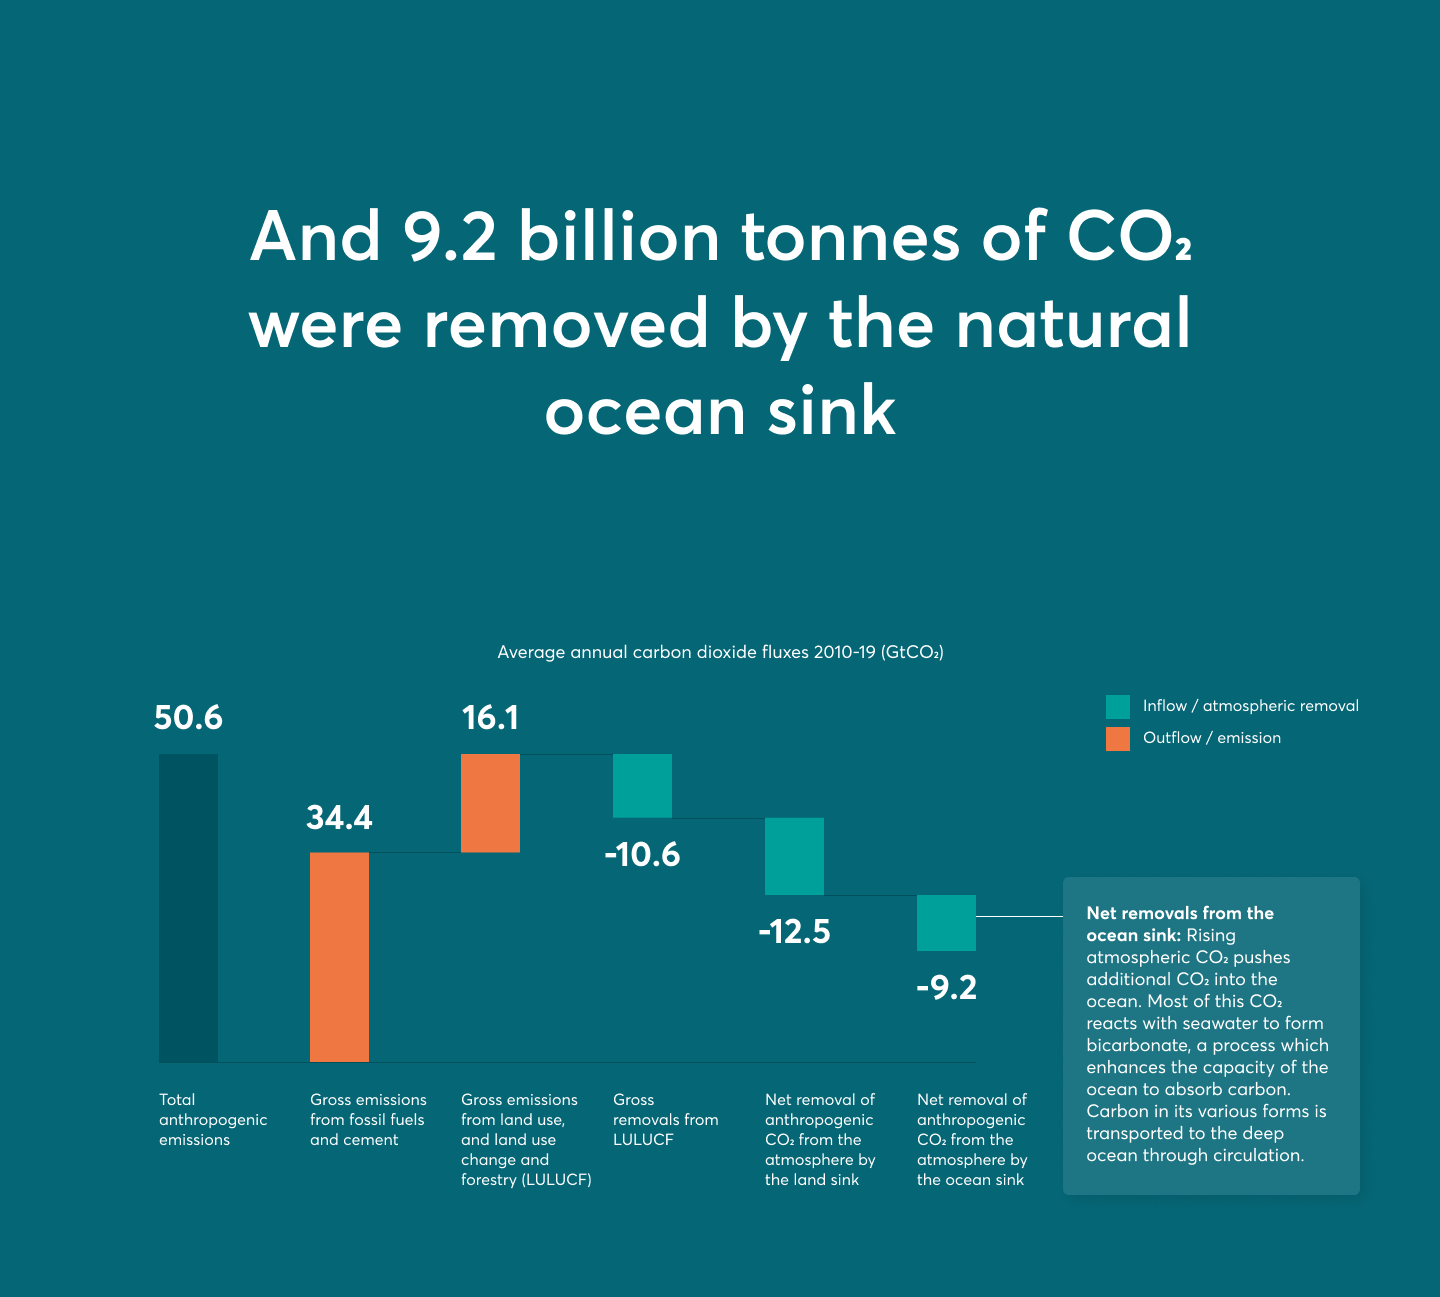
While the has a major regulating role in the climate system, we must be careful about relying on the ocean to remove CO2 from the atmosphere since this increases its acidity with negative impacts on marine ecosystems.Rising atmospheric CO2 pushes additional CO2 into the ocean. Most of this CO2 reacts with carbonate ions in seawater to form bicarbonate, a process which enhances the capacity of the ocean to absorb carbon. Carbon in its various forms is transported to the deep ocean through circulation.
The ocean is a major regulating force in the Earth’s climate system, capturing slightly less than 1/5 of anthropogenic CO2 emissions per year.
But greater concentrations of CO2 also contribute to a rise in ocean acidification which results in negative implications for marine ecosystems, and the effect of ecosystem changes on the CO2 absorbed by the ocean is unknown.
If the risk of acidification were mitigated, significant opportunities could be developed to enhance ocean-based removals, through:
-
blue carbon projects: actions to enhance the capacity of vegetated coastal and marine ecosystems that sequester and store carbon (e.g. mangroves, salt marshes, and seagrass beds).
-
ocean fertilization: applying nutrients to the ocean to increase photosynthesis and sequester carbon.
-
ocean alkalinity: increasing ocean concentration of ions like calcium to increase uptake of CO2 into the ocean, and reverse acidification caused by enhanced CO2 uptake.
While blue carbon projects could reach a strong mitigation potential in 2050 (0.5-1.4 GtCO2e per year), ocean fertilization and alkalinity have highly uncertain feasibility and environmental impacts at this stage.

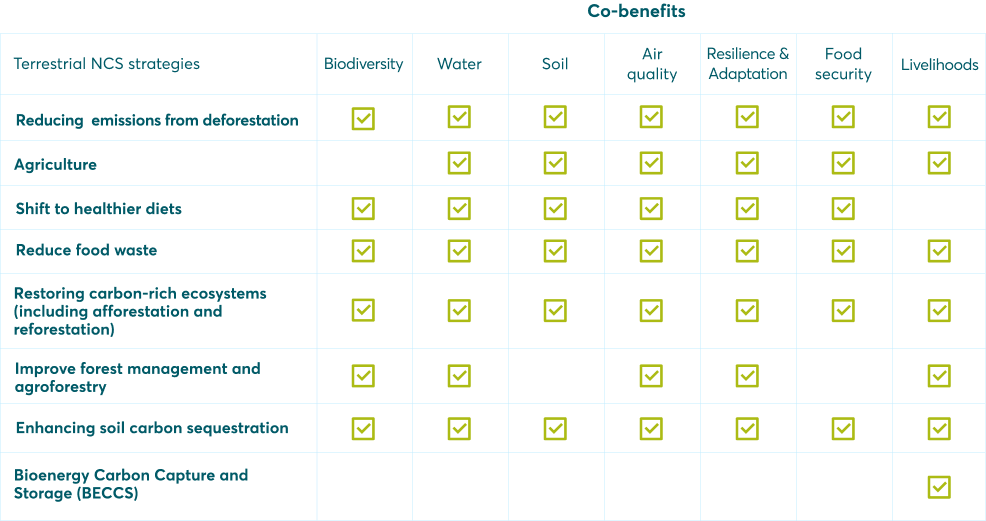
As such, we focus here on land-based or "terrestrial" NCS which can also deliver critical outcomes relating to climate adaptation and resilience, biodiversity and sustainable development.
CO2 sequestration through photosynthesis is the most cost-efficient and oldest carbon removal technology on Earth.
Forests play an essential role in regulating climate and water cycles, protecting against flood, drought and erosion, and maintaining soil and water health.
Mangrove forests provide more than $80 billion per year in avoided losses from coastal flooding and directly protect 18 million people in coastal areas. They also contribute $40–50 billion annually through fisheries, forestry and recreation benefits.
They are also highly cost-effective forms of mitigation, especially when it comes to removing carbon, with the potential to sequester 1.2 GtCO2 for under $30 per tCO2.
NCS removals
| Method | Annual cost & mitigation potential |
|---|---|
| Afforestation, Reforestation & Forest management |
|
| Wetland, peatland and coastal habitat restoration |
|
| Soil carbon sequestration |
|
| Biochar |
|
| Bioenergy with carbon capture and storage |
|
| Bioenergy with carbon capture and storage |
|
| Building with biomass |
|
Human engineered removals & geoengineering
| Method | Annual mitigation potential1 |
|---|---|
| Enhanced terrestrial weathering |
|
| Mineral carbonation |
|
| Ocean alkalinity |
|
| Direct air capture and carbon storage |
|
| Low-carbon concrete |
|